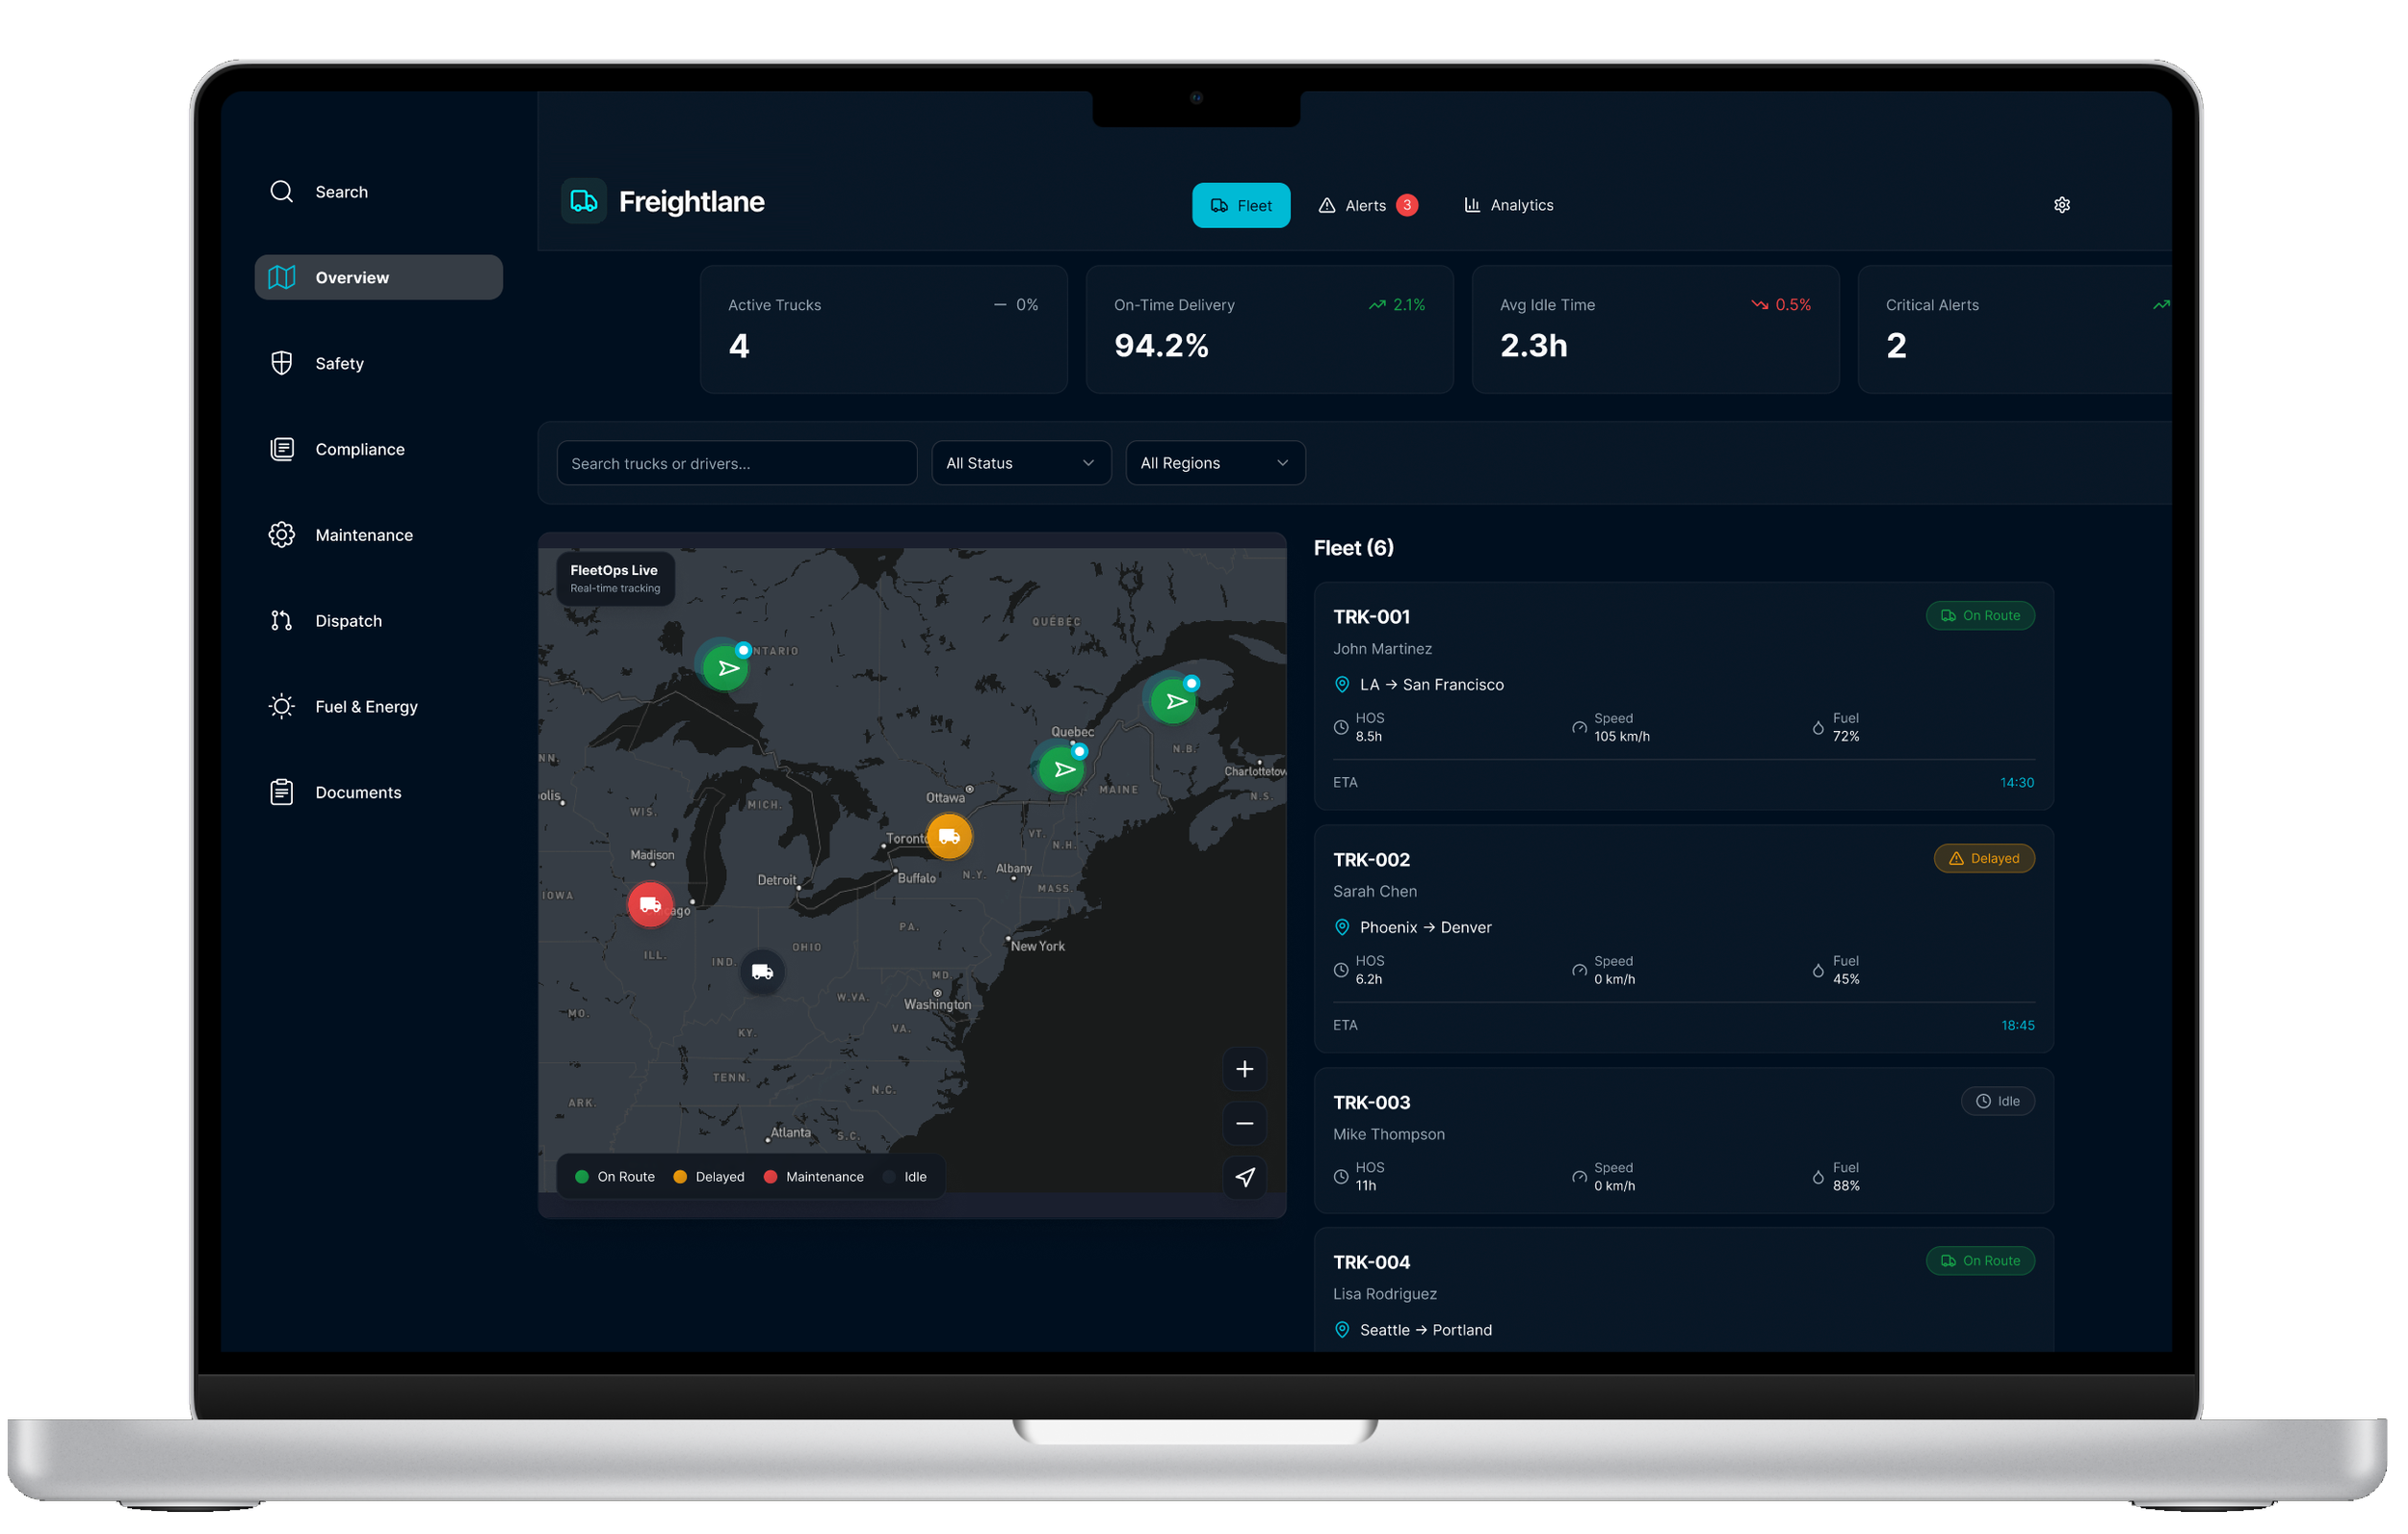
Freightlane: Making Trucking Run Smoother
Freightlane is a mid-size logistics company managing a fleet of 50+ trucks across several states. Their internal dispatch dashboard had become outdated and fragmented, slowing down workflows and creating unnecessary operational friction.
The client asked for a more “Uber-like” design and experience - clean, intuitive, and built for real-time action. I led the end-to-end redesign to streamline dispatch operations, elevate live fleet visibility, and enable faster, more confident decision-making. Within the first three months after launch, FleetOps recorded a 35% improvement in route efficiency, a 22% reduction in idle time, and an 18% savings in fuel-related costs.
Challenge
Logistics teams had to juggle multiple tools just to plan and track a single route:
Outdated (sometimes misleading) dashboard features, spreadsheets for load details, separate systems for maintenance alerts, and manual phone updates from drivers.
Pain Points
No unified view of trucks, routes, loads, and delays
Dispatchers switching between 4–6 tools
Zero predictive insights
Poor communication between dispatchers and drivers
Maintenance alerts easy to miss → costly breakdowns
Limited historical data for optimization
The lack of integration created delays, increased operational costs, and lowered both dispatcher and driver satisfaction.
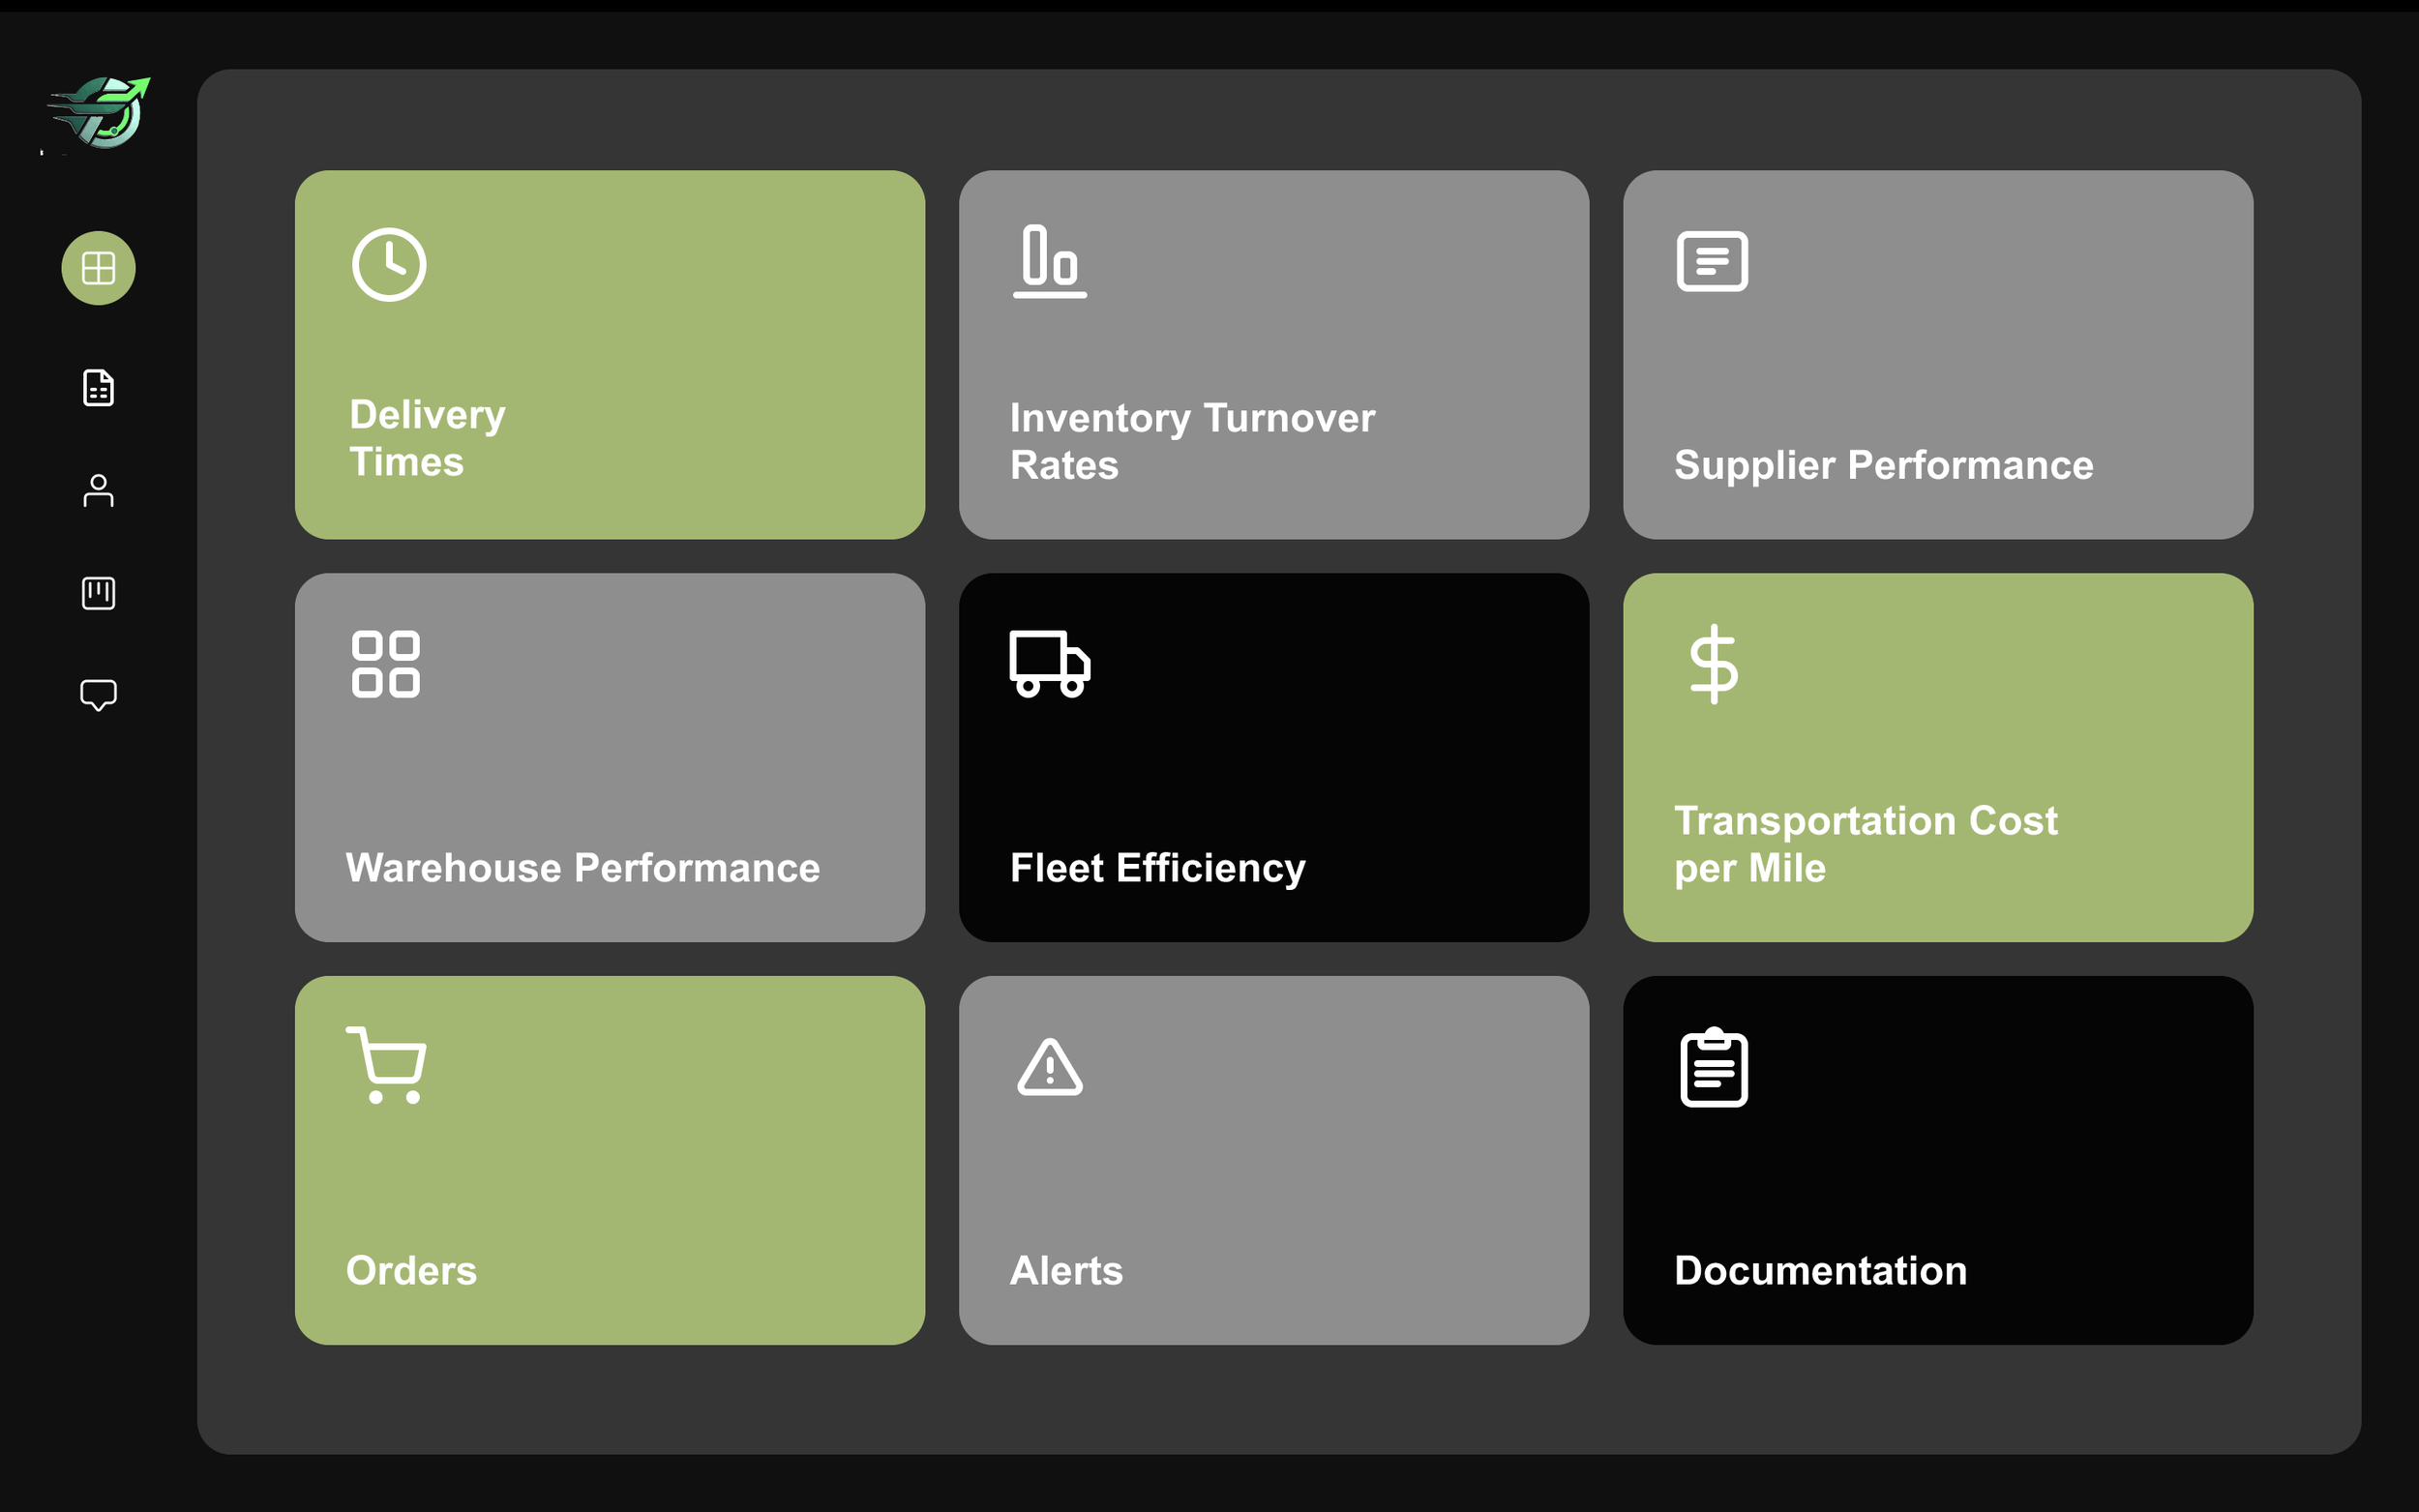
Old Dashboard
Goals


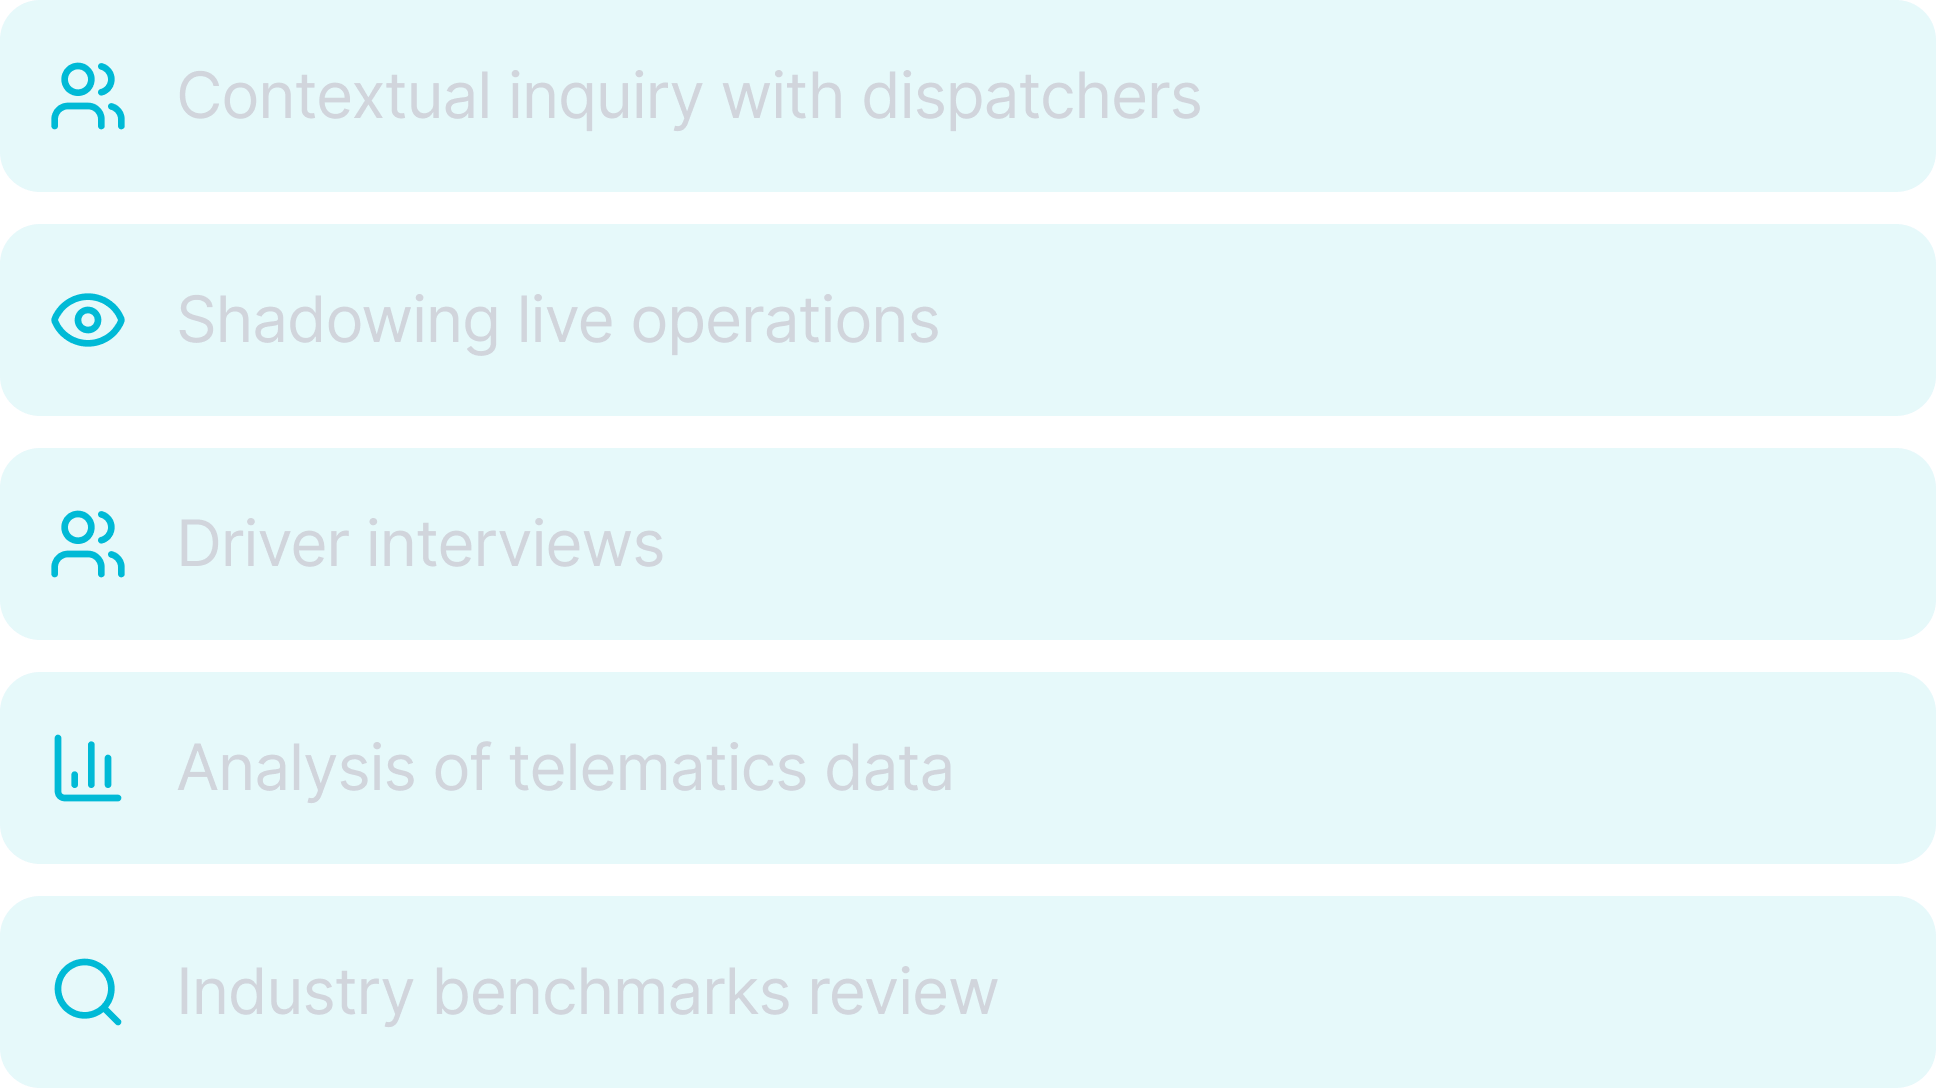
Research
Methods
Insights
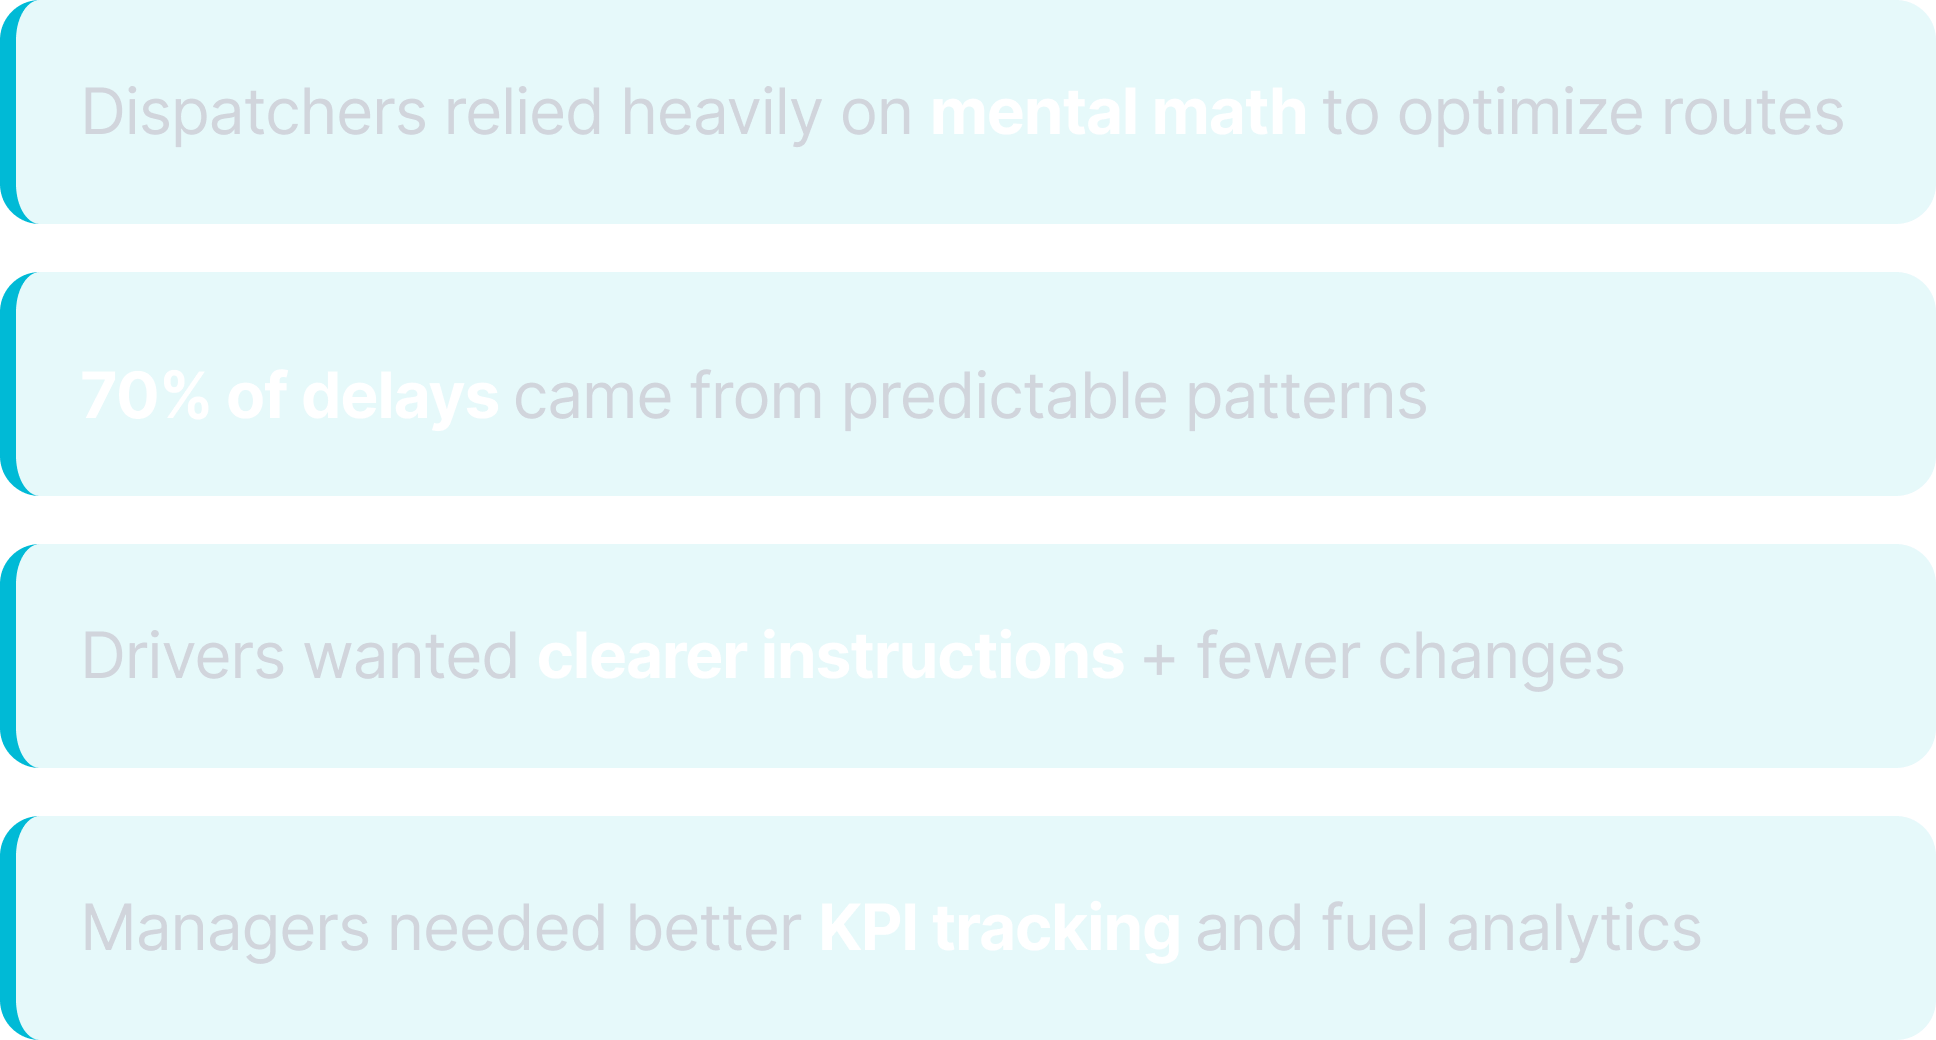
Key Opportunity: A dashboard that anticipates problems before they happen
Strategy
The redesign focused on four pillars:


User Journey Maps
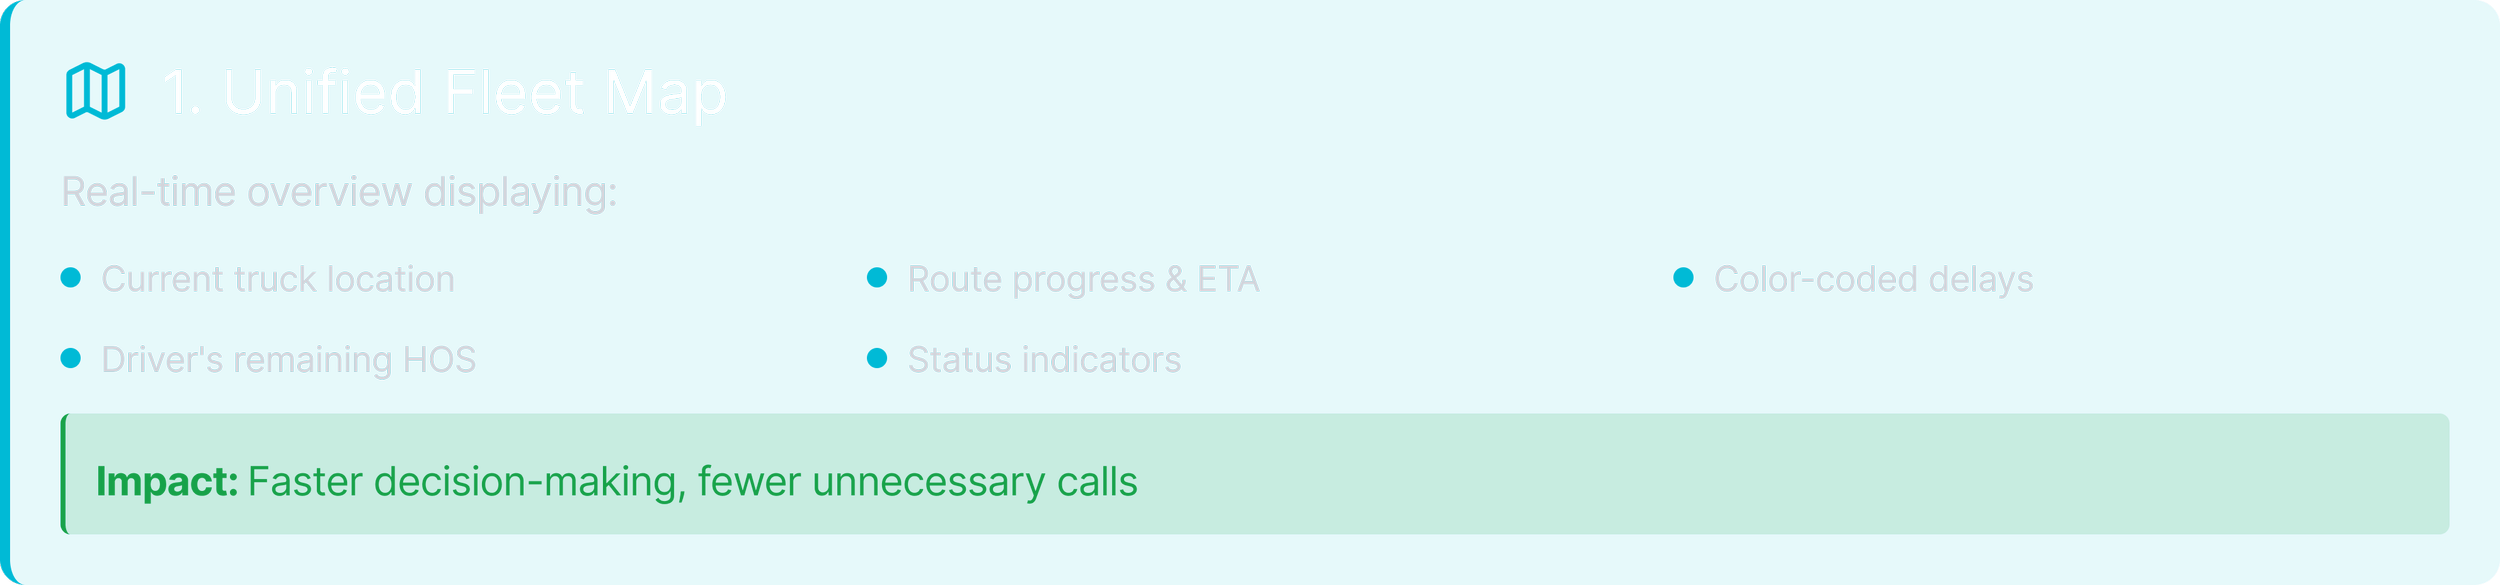
Unified Fleet Map
Dispatcher uses the unified fleet view to monitor status, identify issues, and act quickly.
| Stage | Step | User Thoughts | Opportunities |
|---|---|---|---|
| Awareness | Logs in and sees the fleet map with key KPIs at the top. | “Is anything urgent right now?” | Clear status colors and a concise KPI strip for at-a-glance fleet health. |
| Exploration | Applies filters (status, region, driver), zooms in, and checks delayed trucks. | “Where are the problems?” | Smooth map interactions, instant filtering, and the ability to save common views. |
| Decision | Selects a specific truck to inspect further. | “What’s happening with this one?” | Fast detail drawer, clear hierarchy, obvious primary actions. |
| Action | Messages the driver or initiates rerouting. | “How do I fix this quickly?” | One-click suggested actions and immediate confirmation feedback. |
| Resolution | Closes the panel and returns to the fleet map. | “Good. Next issue.” | Live updates and action logs. |
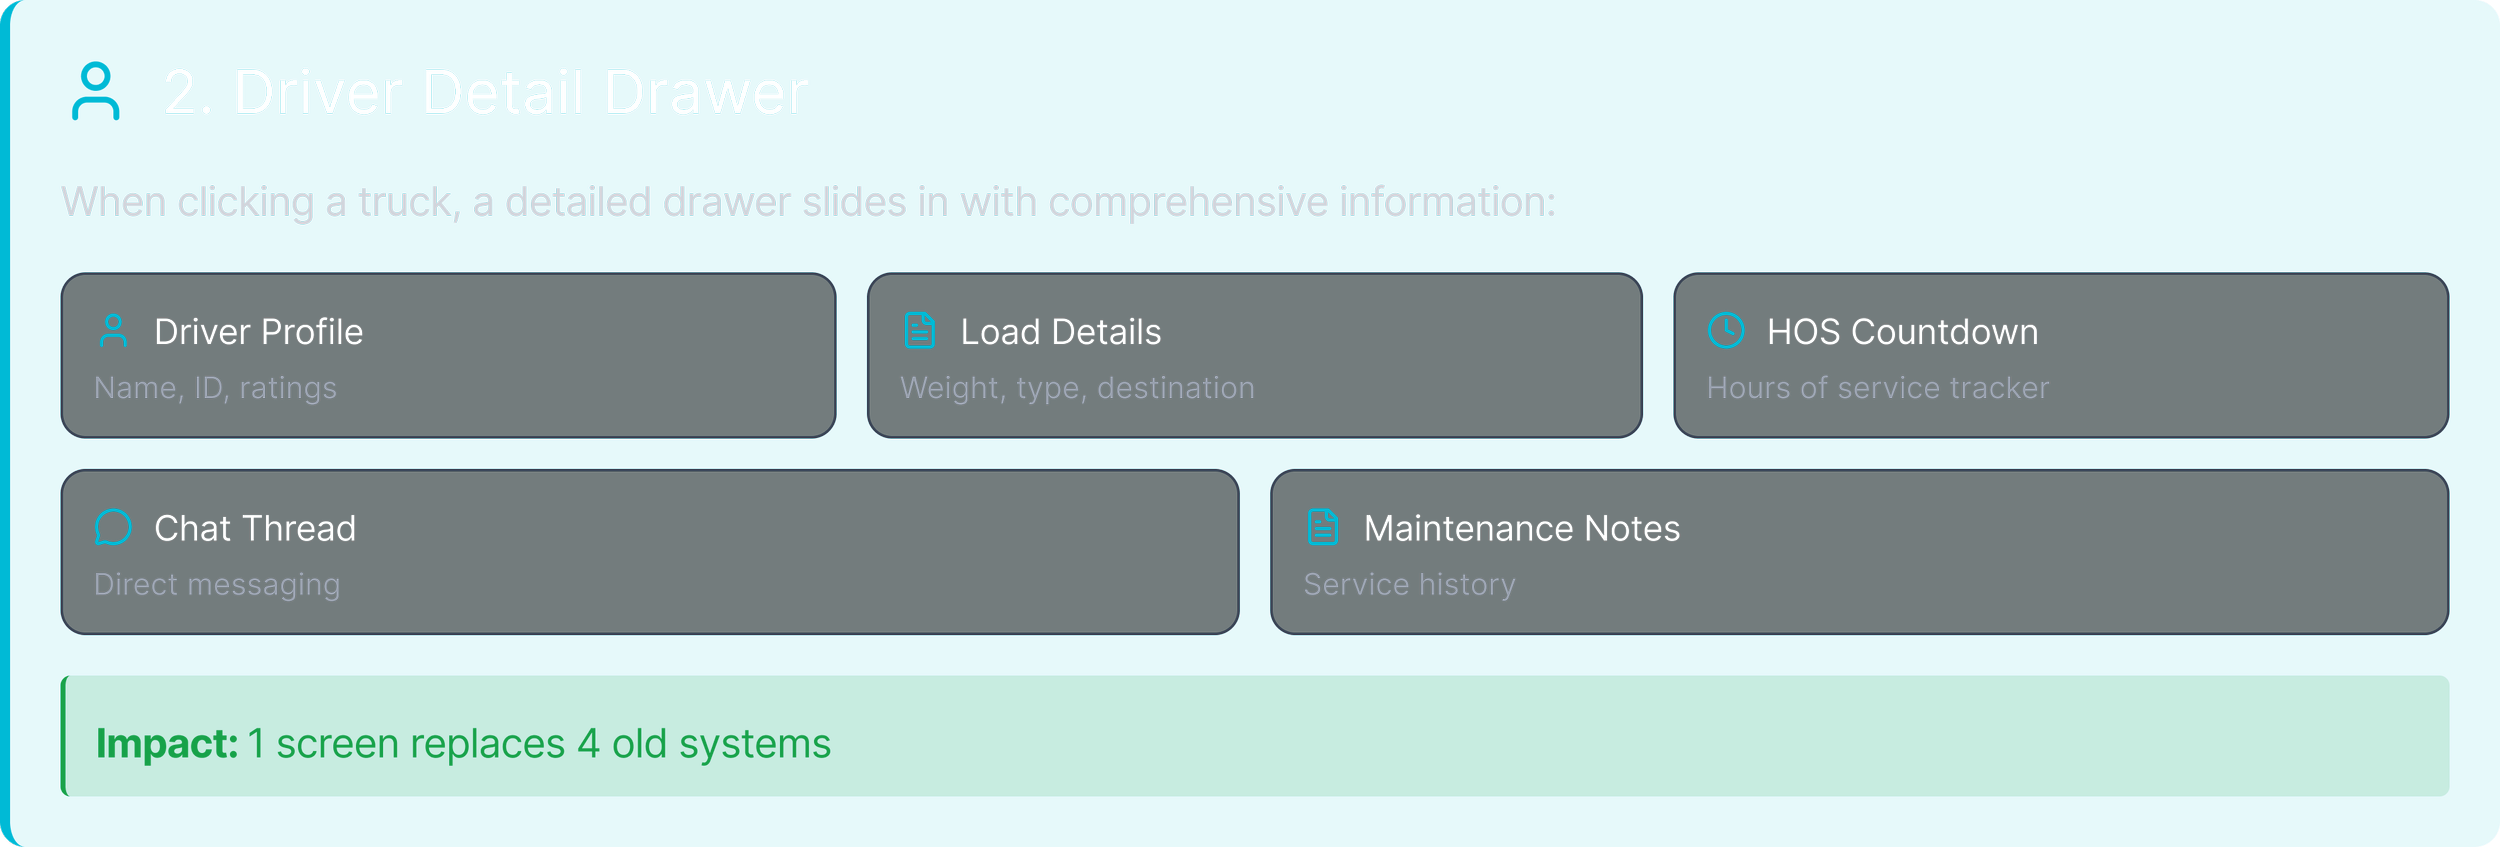
Driver Detail Drawer
Dispatcher opens the driver drawer to quickly understand one truck, route, and driver in context.
| Stage | Step | User Thoughts | Opportunities |
|---|---|---|---|
| Awareness | Notices an anomaly (delay, idle, alert) and opens the driver drawer from the fleet map or list. | “Something’s off here.” | Instant panel load, clear header summary (driver, truck, route), consistent drawer animation. |
| Exploration | Scans route progress, remaining HOS, ETA, load details, and maintenance flags. | “Why is this happening and how bad is it?” | Strong information hierarchy, risk badges, and visual indicators for late or at-risk deliveries. |
| Decision | Evaluates whether to reroute, adjust timing, or simply contact the driver. | “Do I need to intervene right now?” | Contextual suggested actions such as “Propose reroute,” “Update ETA,” or “Notify customer.” |
| Action | Sends a message, updates route instructions, or modifies delivery window directly from the drawer. | “Let me fix this before ETA slips further.” | Quick-reply templates, one-click route changes, and visible confirmation of saved updates. |
| Resolution | Closes the drawer and returns to the fleet map with updated status and ETA. | “Good. What’s next?” | Live refresh on the map, recent actions log, and reassurance that the issue is now tracked. |
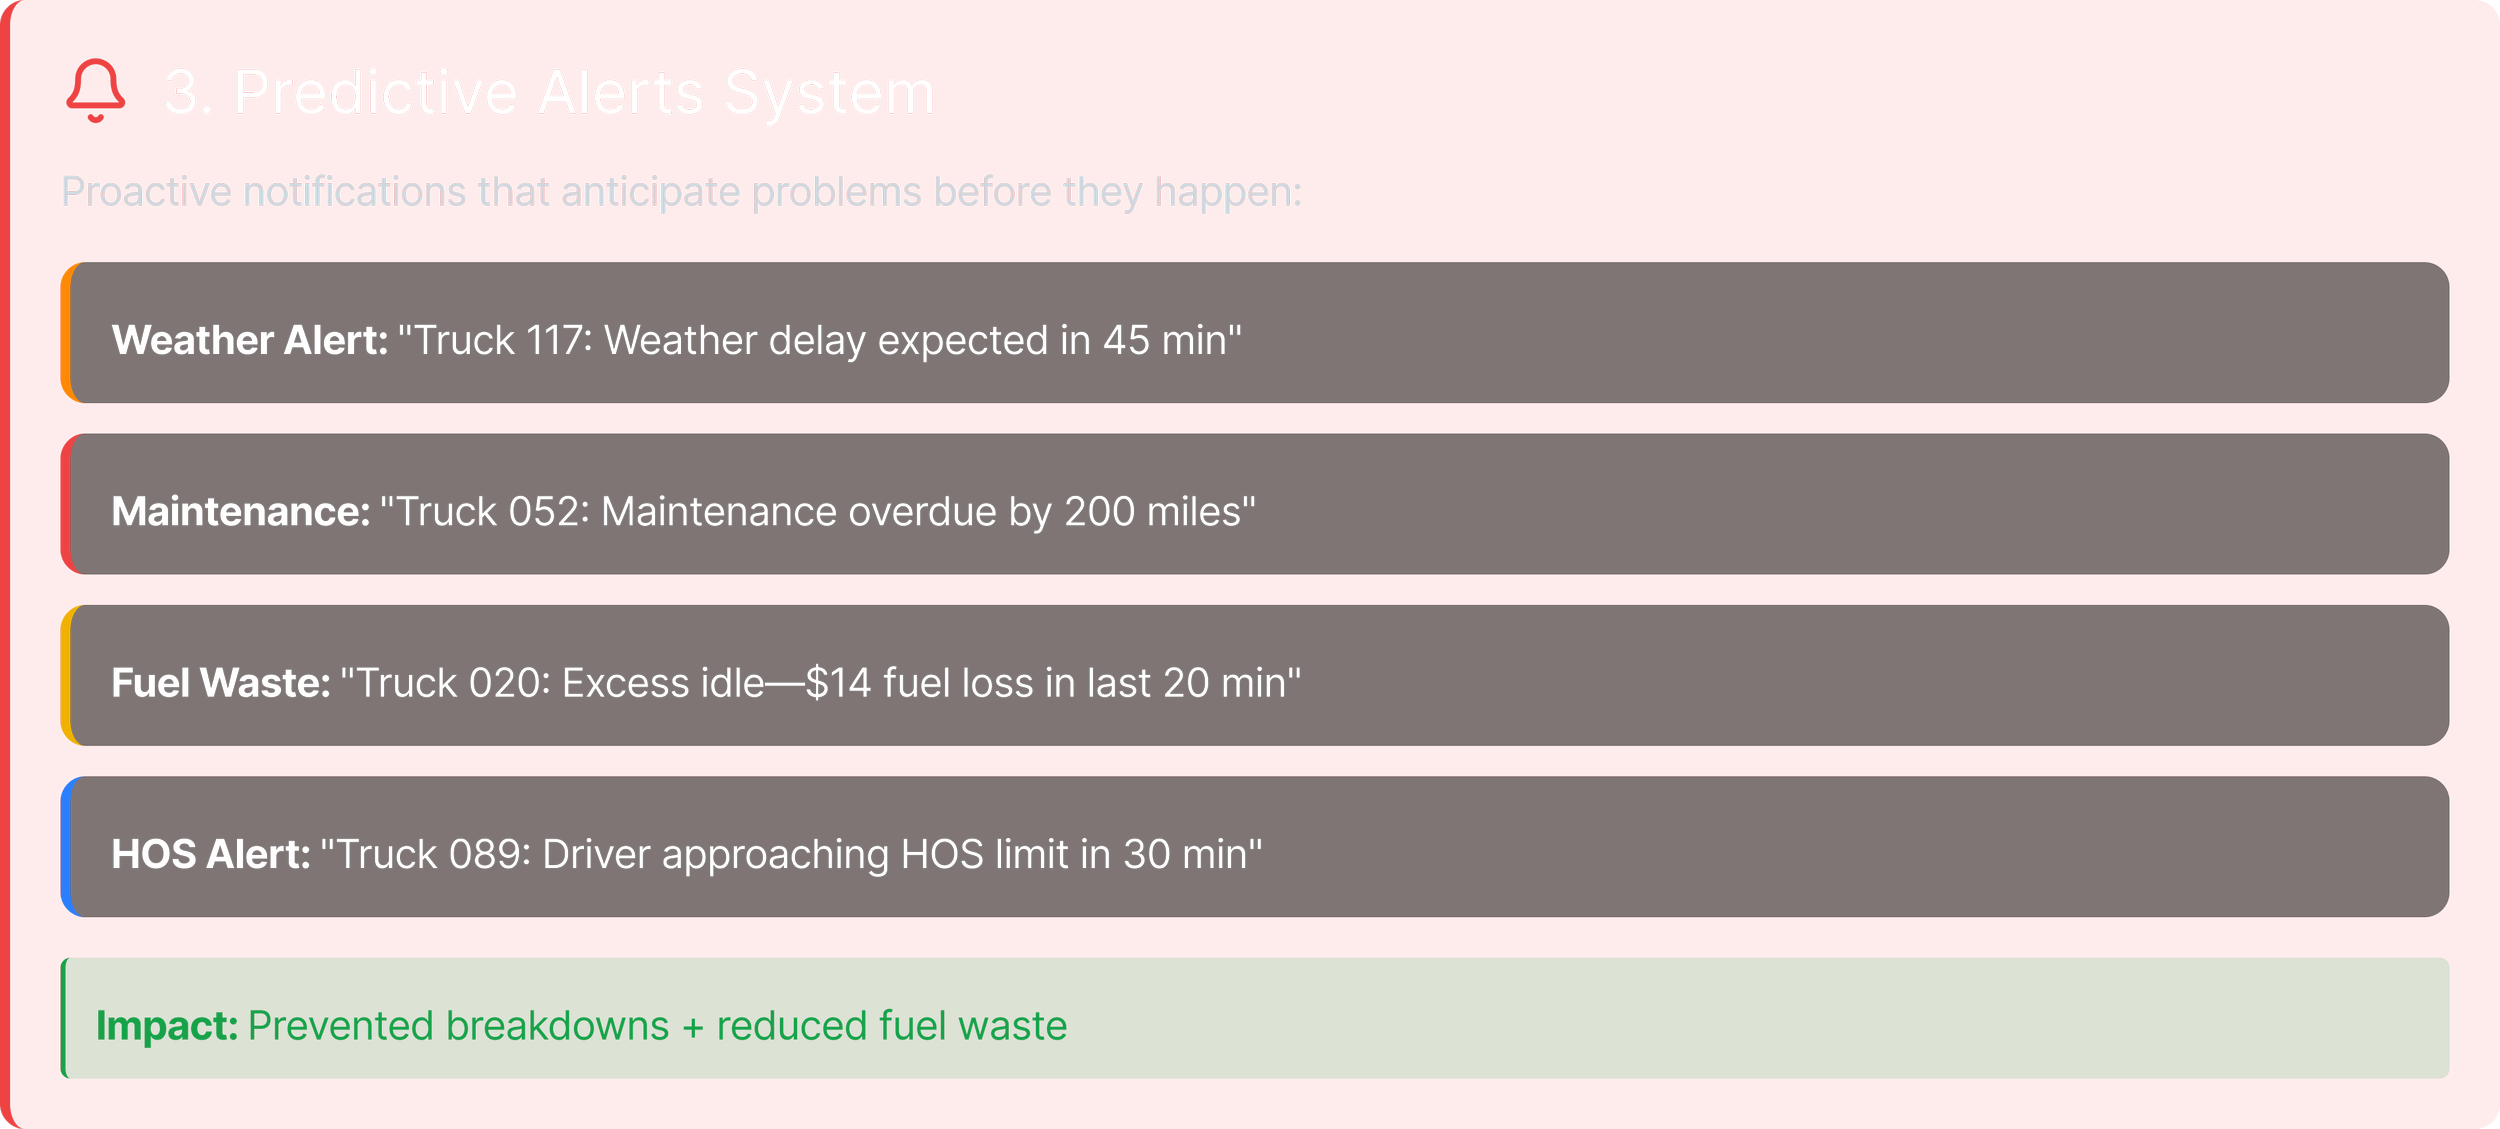
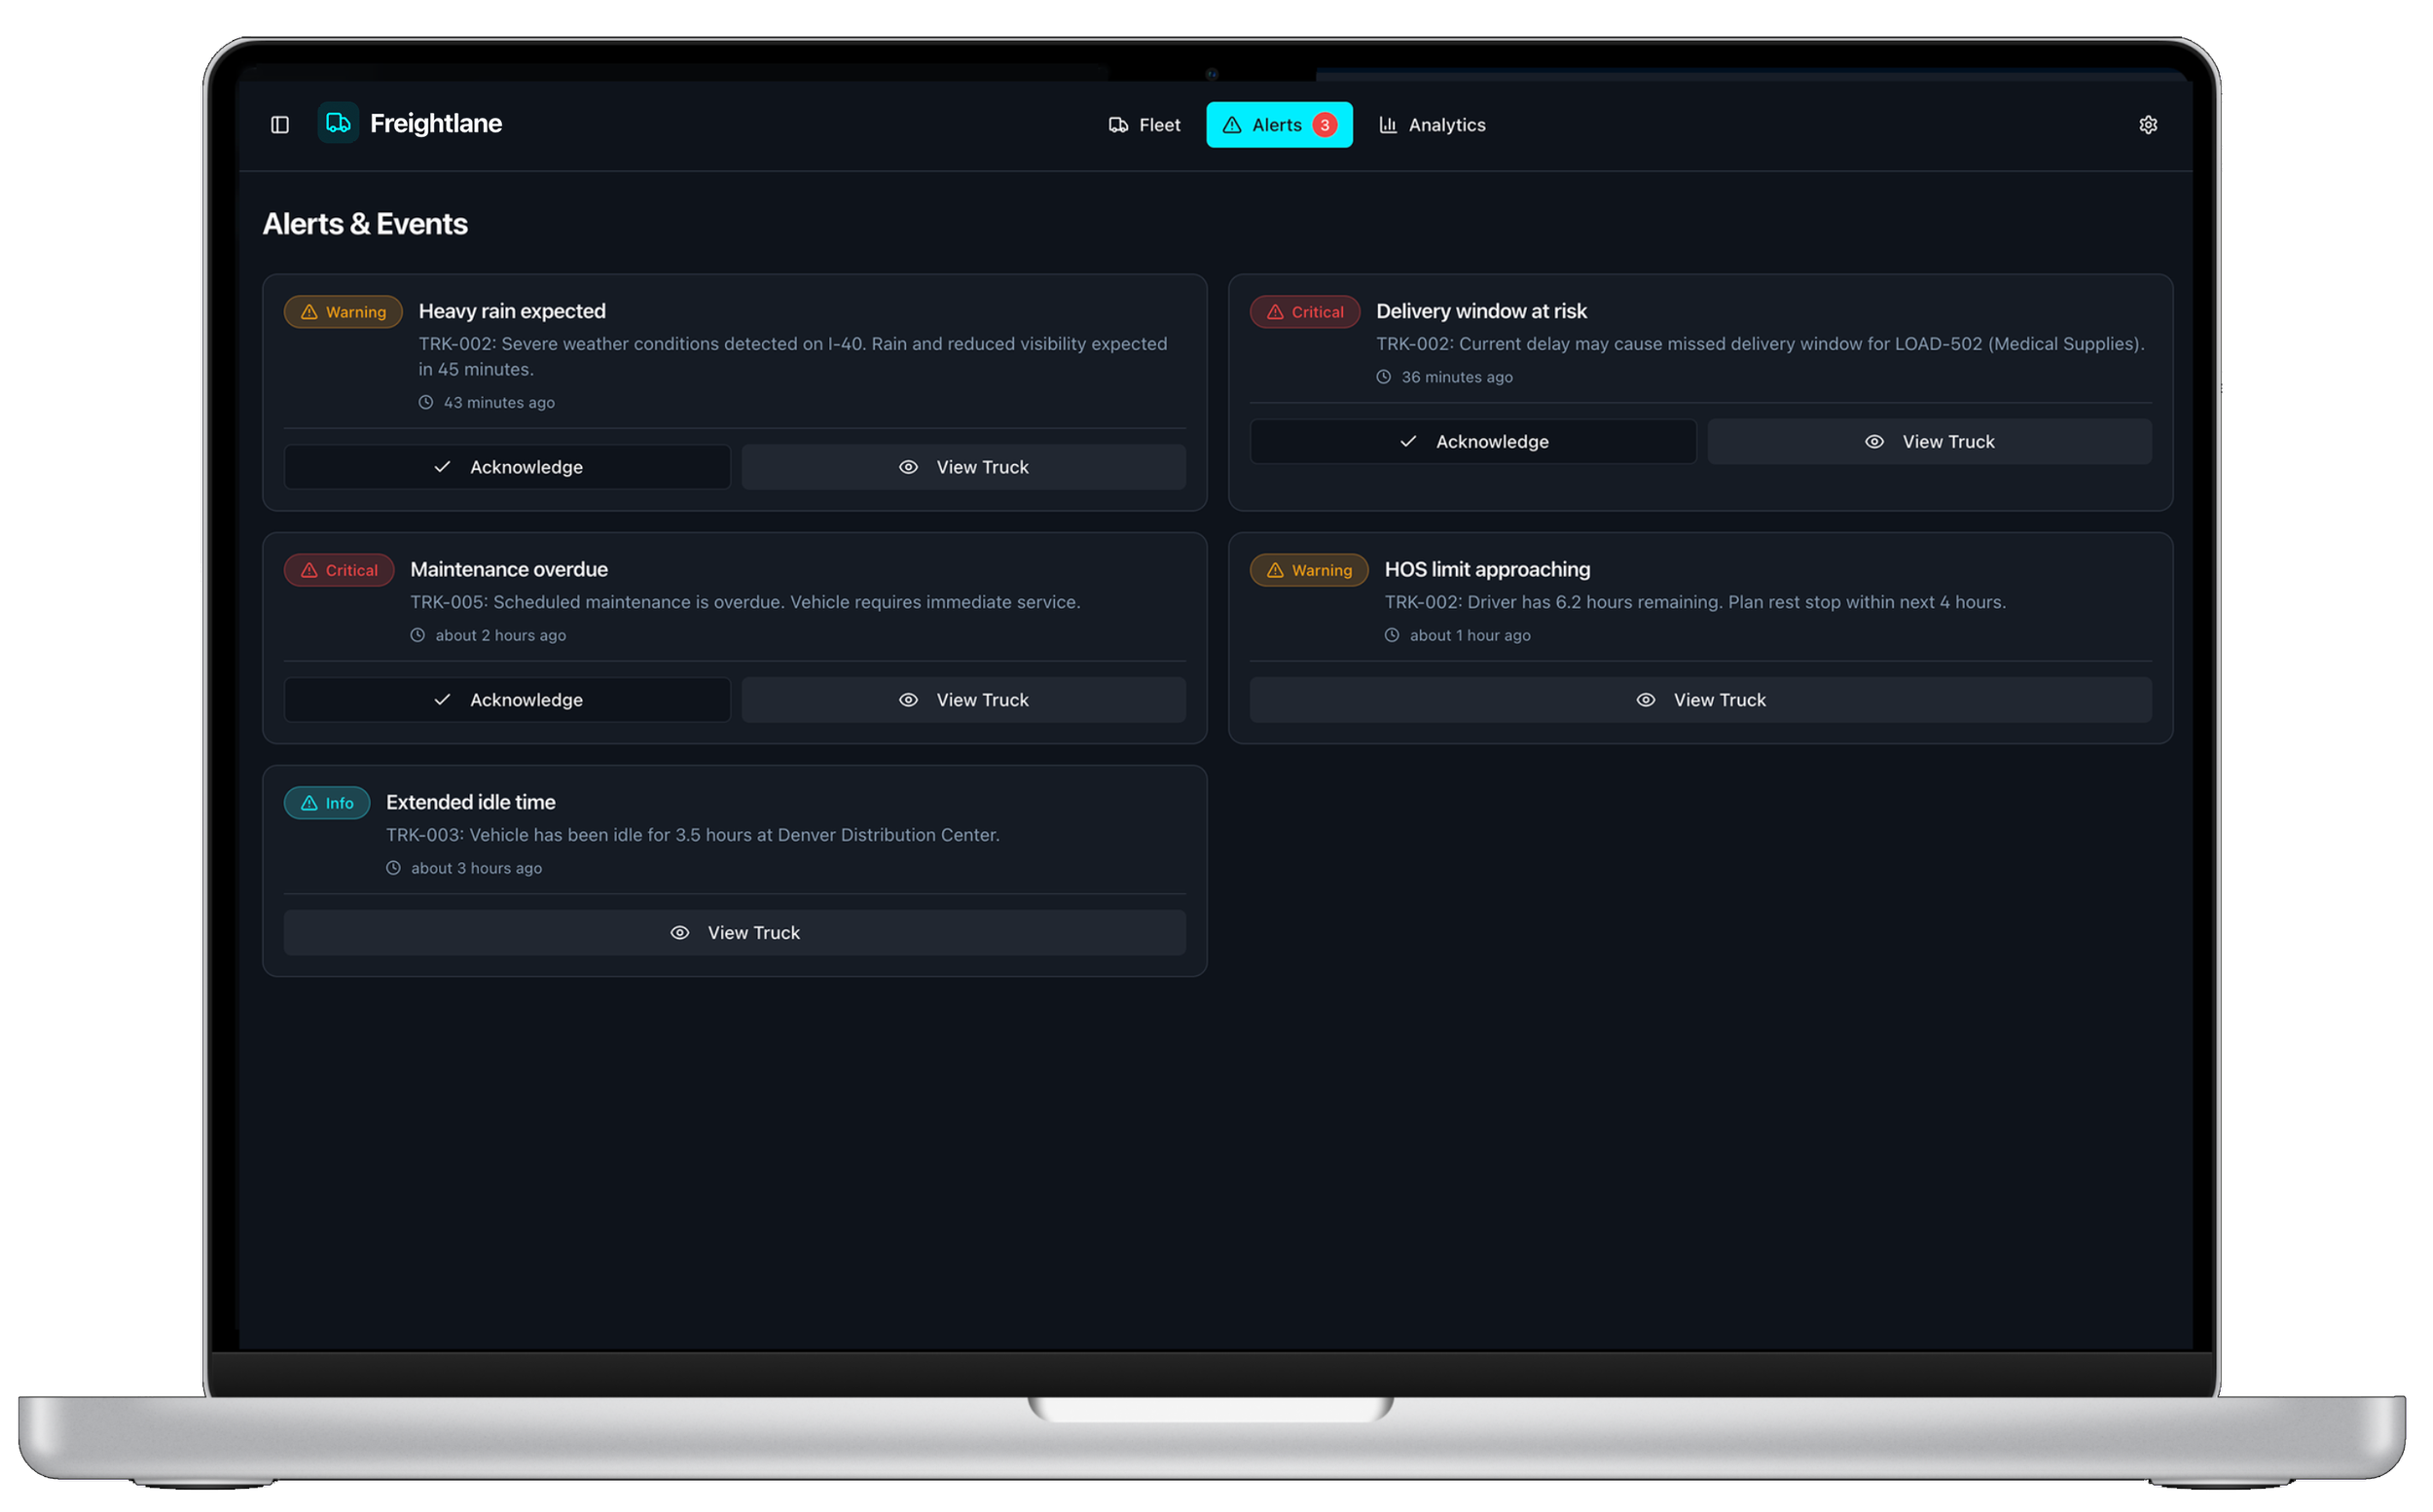
Predictive Alerts System
Dispatcher uses predictive alerts to detect risks early and prevent delays or safety issues.
| Stage | Step | User Thoughts | Opportunities |
|---|---|---|---|
| Awareness | Receives a new alert and opens the Alerts view to understand what happened and which truck is affected. | “Is this urgent? Do I need to jump on it now?” | Clear severity levels, concise titles, visible timestamps, and grouping by alert type or route. |
| Exploration | Reviews alert details such as weather, traffic, HOS risk, or maintenance issues and sees impact on ETA or delivery window. | “How serious is this and what happens if I do nothing?” | Plain-language risk descriptions, link to truck or route, and simple visualization of impact. |
| Decision | Sorts and prioritizes alerts by severity, region, or SLA and chooses which one to handle first. | “What should I tackle right now?” | Smart sorting, SLA indicators, and suggested next actions like “View on map,” “Reroute,” or “Message driver.” |
| Action | Reroutes a truck, sends a message to the driver, or acknowledges/snoozes the alert from the same screen. | “Let me fix this before it becomes a bigger problem.” | One-click resolution flows, quick-reply templates, and confirmations that the alert is now handled. |
| Outcome | Alert moves to Resolved or Snoozed; fleet view and KPIs update to reflect the intervention. | “Good, that’s under control. What else needs my attention?” | Alert history, patterns for recurring risks, and metrics on avoided delays or saved time. |
Final Design

Results
(First 90 Days)
| KPI | Before | After | Change |
|---|---|---|---|
| Route Efficiency | Baseline | Improved | +35% |
| Idle Time | High | Lower | −22% |
| Fuel Costs | Rising | Stable | −18% |
| On-Time Deliveries | Inconsistent | Improved | +27% |
| Dispatcher Workload | Heavy | Lighter | −33% |
| Driver Satisfaction | Mixed | Better | +21% |
The biggest shift: Planning became proactive, not reactive. FleetOps could now prevent problems before they hit the road.
NEXT STEPS
What I'd Improve Next
Driver Mobile App Redesign
Optimize the driver experience on mobile devices
Gamified Driver Incentives
Reward efficiency improvements and safe driving
Automated Load Assignment
Smart matching of loads to optimal drivers and routes
Insurance & Compliance Integrations
Streamline compliance tracking, safety reporting, and insurance claim management
AI Forecasting
Predict seasonal demand and optimize fleet capacity